Decided to take a look at AER’s ST13 to compare gas plants/fields/companies in Alberta. It shows the inlet, products, fuel, flaring, and metering differences for each plant in the province, as well as location. Here is an image of all the gas plants in the south/central region of Alberta. The size represents the raw inlet gas, and the color represents the field.
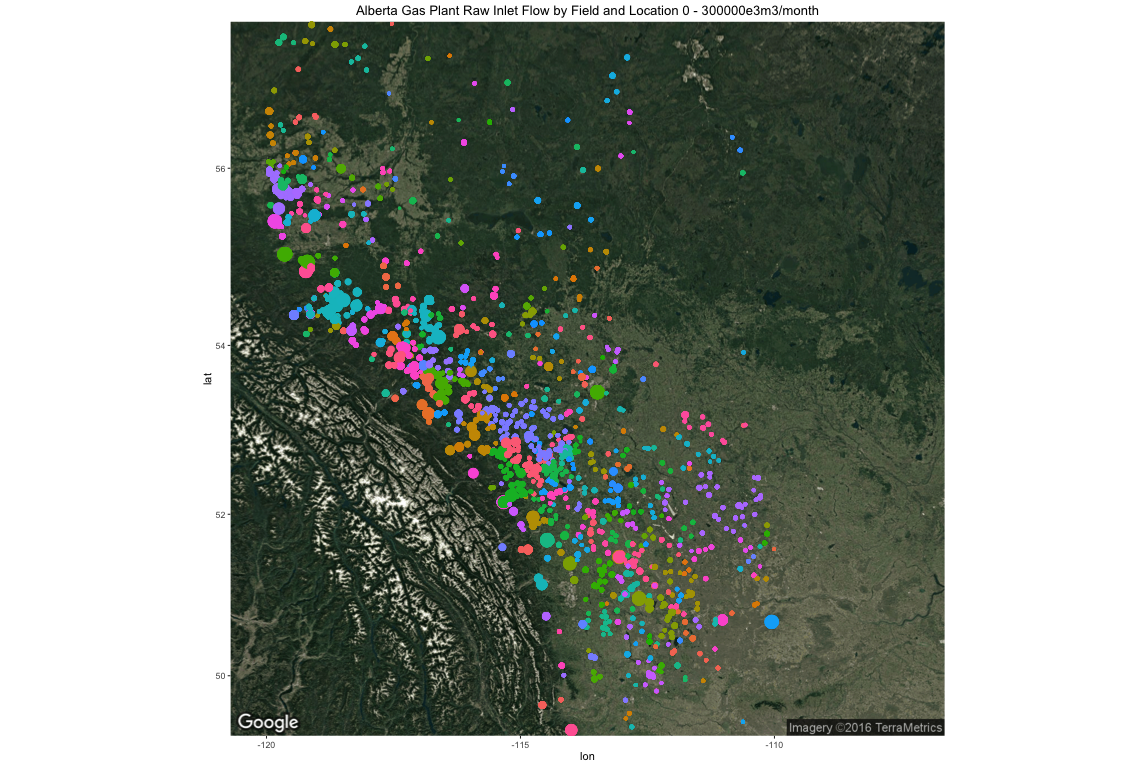
Legend Here
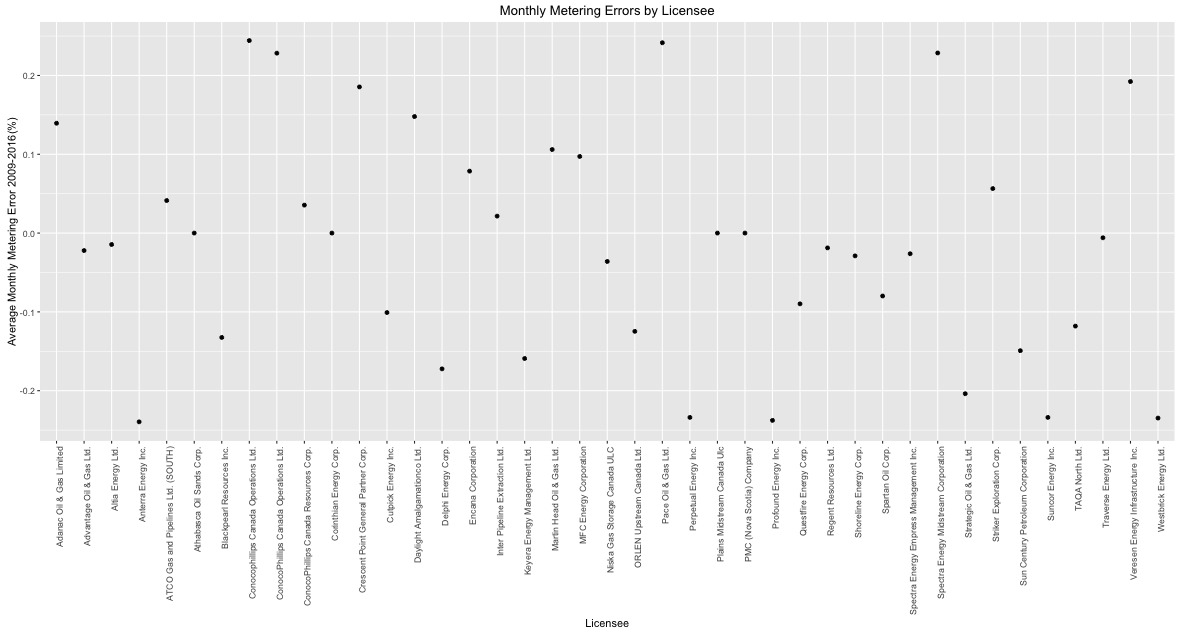
Then I thought I would see which Licensees had the best metering balances from 2009-2016, anything over 5% is an issue, depending on the inlet volume (could be even less than 5%). The monthly average of the positive errors (took in more than sold) is 3.36% for all gas plants from 2009-2016. The monthly average of negative errors (sold more than took in) is -2.42%.
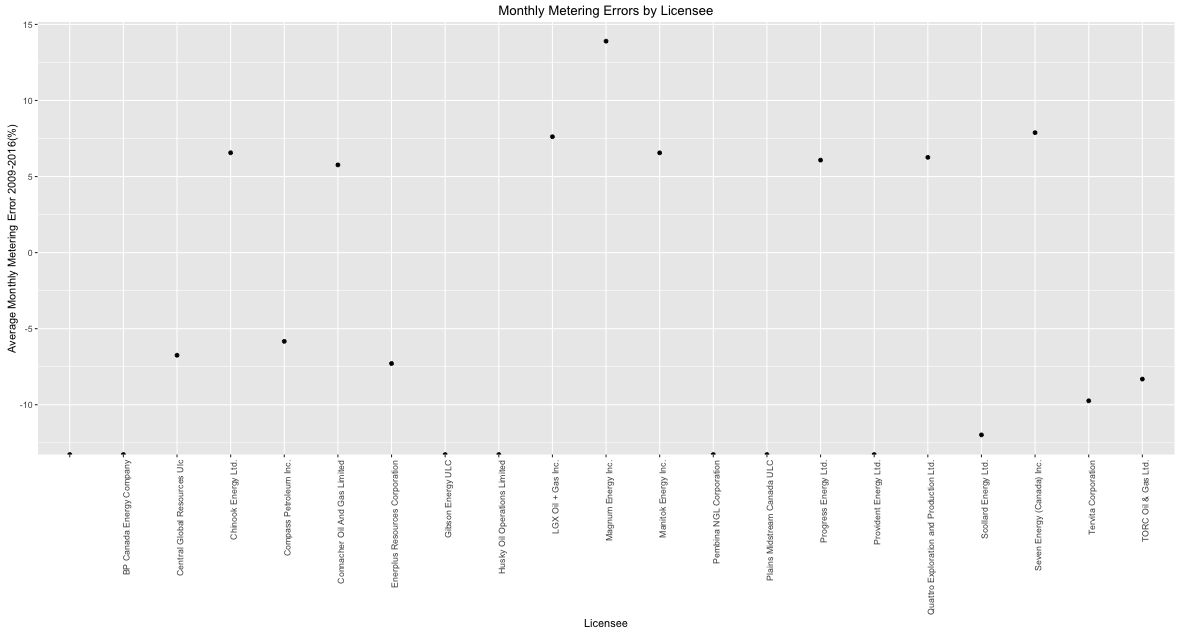
Here are the worst.
Here is a comparison of several different licensees to compare the amount of fuel consumption to inlet flow.
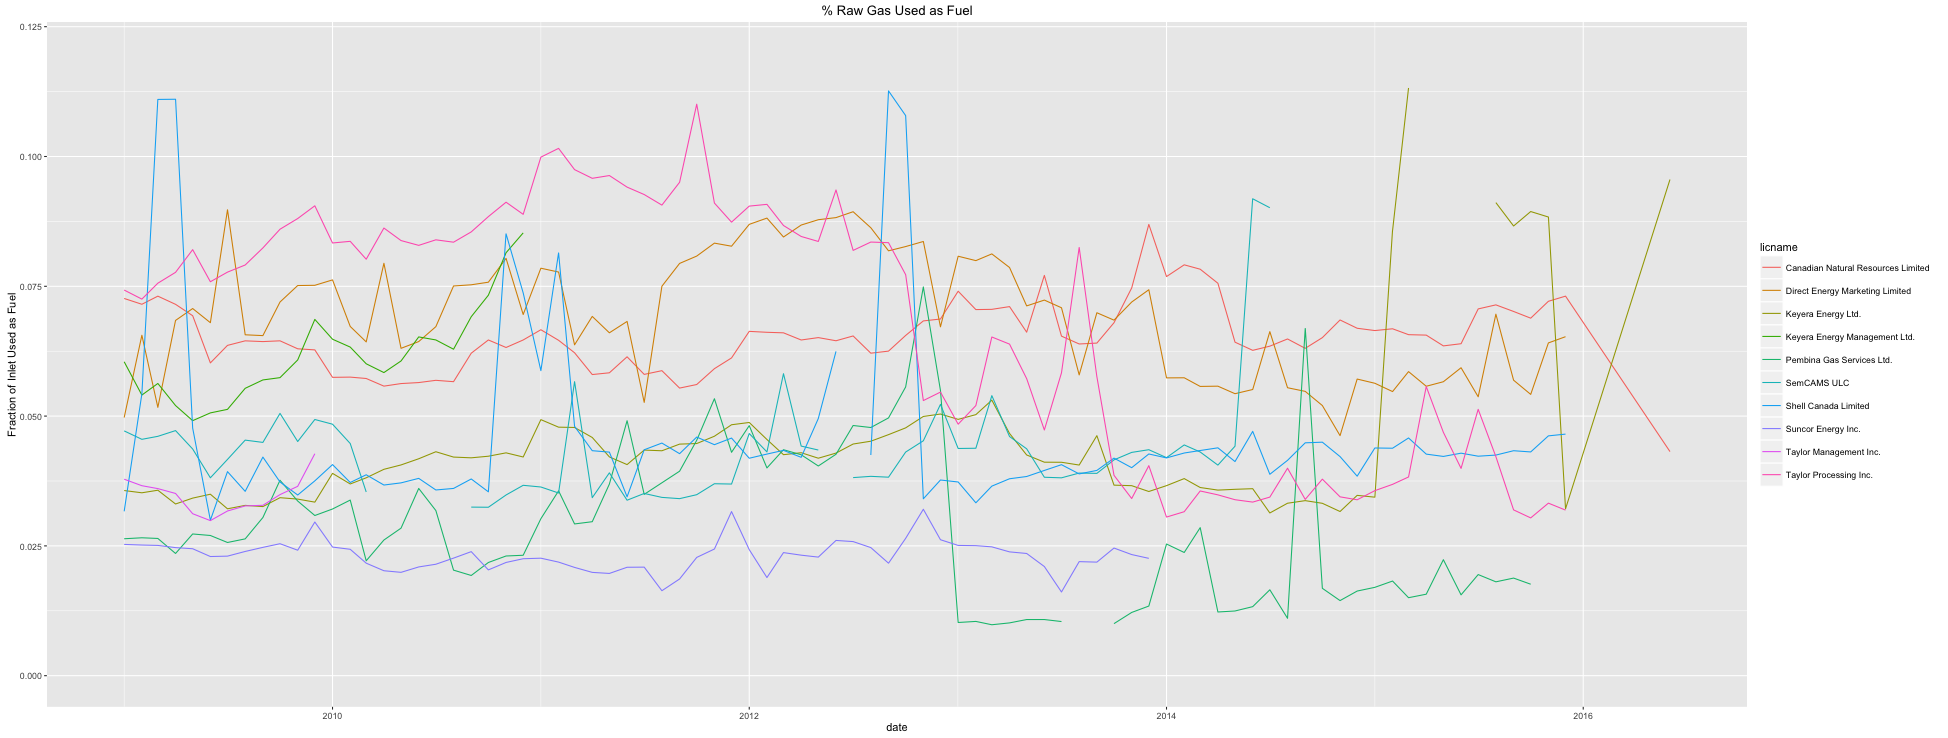
The average fuel consumption across every plant in the province is 5.8% of raw inlet flow.
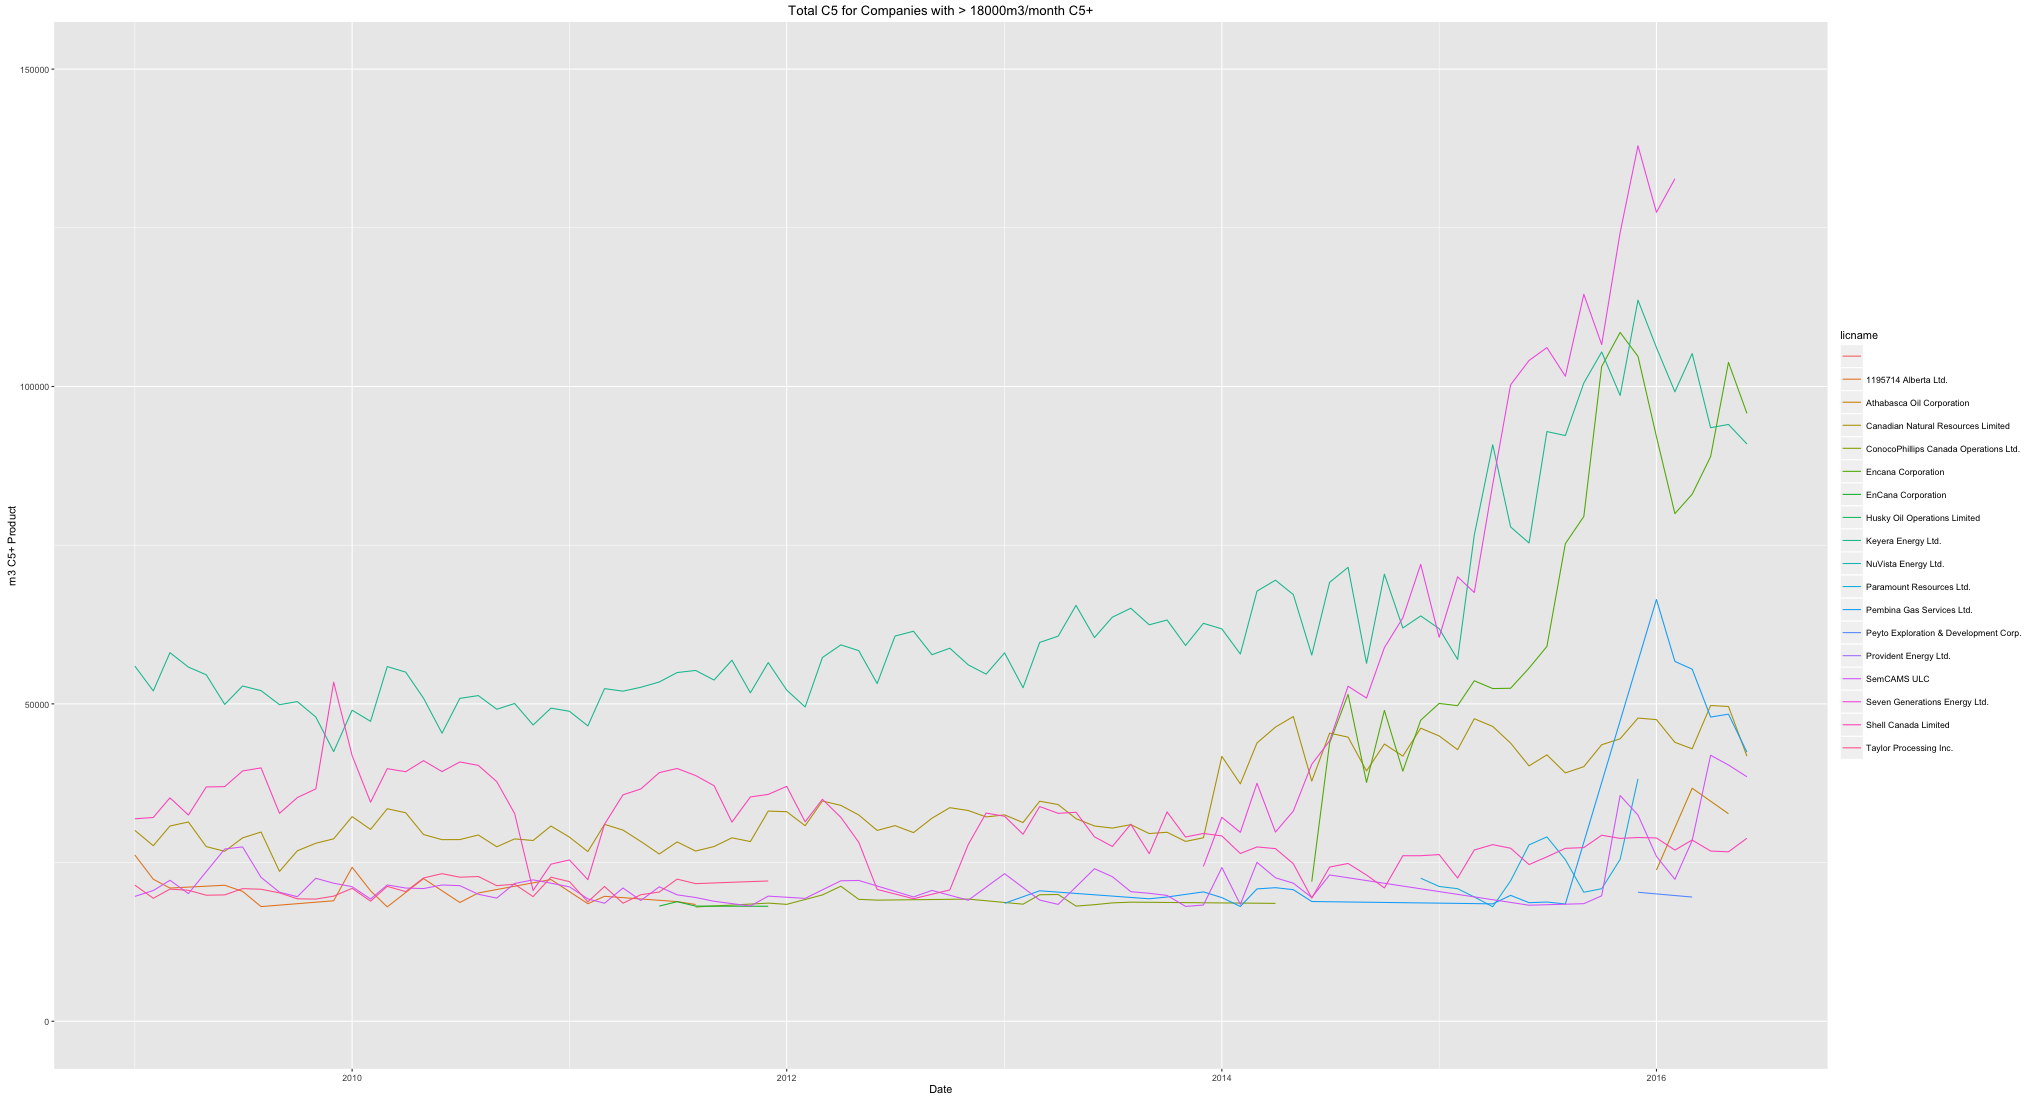
Here is an amazing tale of some up and coming companies, who have massively increased their C5+ production, surpassing some of the old large fields.
Comments
There are currently no comments on this article.
Comment